


What is PageSpeed Insights?
PageSpeed Insights (PSI) is an analytics tool offered by Google for the evaluation of website performance across desktop and mobile devices. The Google PageSpeed score of each URL is a reference value calculated from the metrics used for search engine optimization (SEO).
Google first introduced page load speed as a ranking factor for their search algorithms in 2010. This was supplemented in 2018 to extend to mobile search results. In 2021, the Page Experience Update established Core Web Vitals as a key metric for search engine results ranking. PSI implements the Lighthouse framework for calculating Google PageSpeed scores.
PageSpeed Insights allows publishers to view their website’s desktop and mobile performance through an online interface or by using Chrome DevTools. It is also possible to run Lighthouse for URL analysis using the command line or a Node.js API. By using PageSpeed Insights, developers can view the performance of each webpage and receive feedback for improvement.
The Core Web Vitals metrics are based on three main metrics: Largest Contentful Paint (LCP), First Input Delay (FID), and Cumulative Layout Shift (CLS). These values measure the responsiveness, stability, and page load speeds of any URL. Websites that score higher on these metrics will usually receive better rankings on Google’s search engine results pages.
The 10Web Booster platform is a powerful SEO tool for web publishers that will optimize any website’s performance to get a higher Google PageSpeed score and pass the Core Web Vitals assessment automatically. Your domains can receive a 90+ PageSpeed score by implementing solutions for CSS/HTML compression, JavaScript minification, and the lazy-loading of images.
PageSpeed vs. load time
The calculation of the Google PageSpeed score includes multiple factors like Total Blocking Time (TBT), Largest Contentful Paint (LCP), and Cumulative Layout Shift (CLS). These factors contribute 30%, 25%, and 15% to the final PageSpeed score respectively.
Other factors measured in the calculation are First Contentful Paint (FCP), Time to Interactive (TTI), and the Speed Index (SI). These factors each contribute 10% of the total PSI score.
Lighthouse uses the Speedline Node.js module developed by WebpageTest.org to calculate the Speed Index (SI) score. The Speedline module measures the visual progress of a website in histograms to determine how fast the content is rendered across the user experience.
Benchmarks like the Speed Index (SI), First Contentful Paint (FCP), and Time to Interactive (TTI) measure the viewable area of the content pane from the time that rendering begins until it is visually complete. Thus, the PageSpeed score is different than the total load time of a URL.
How does PageSpeed Insights work?
Google’s PageSpeed Insights currently runs on the open-source Lighthouse framework which measures the relevant performance information from a domain and generates feedback for the user on how to improve desktop/mobile displays. This data is provided to publishers so that websites can be transparently optimized for SERPs on fixed benchmarks to improve rankings.
In calculating the search engine results, Google algorithms will rely on the field data that is collected by Chrome User Experience Reports over time. The PageSpeed Insights service allows publishers to see what users experience when loading their web pages on different devices. By analyzing the page load times for desktop and mobile, publishers can fix errors, optimize script performance, and implement web server solutions that boost user experience.
In order for a web page to rank highly in the Google search results pages, it will need to have a high PageSpeed score. PageSpeed Insights removes the mystery from the ranking process by exposing the variables used by the search algorithm. This allows publishers to optimize their scripts for performance through caching, compression, minification, lazyload, and other tactics.
How to use PageSpeed Insights?
PageSpeed Insights is a benchmarking resource that allows publishers to test any URL on a website for performance and receive feedback on how to improve it. The framework does not make any changes or optimizations to website code. PageSpeed Insights tests web pages by URL for the expected load time on different devices and makes the data accessible publicly.
Web publishers can use PageSpeed Insights to test the home page, landing pages, product catalog for ecommerce sites, and content like articles or blogs. After entering the URL address, you will receive a diagnostic report for desktop and mobile device displays. The PageSpeed score ranges from 0 to 100 with a grade report of “good”, “needs improvement”, or “poor”.
Online business owners seeking the highest ranking for SEO need to target a Google PageSpeed score of 90 to 100 across all landing pages and site content. The use of solutions like website caching, HTML/CSS compression, JavaScript minification, and the lazy-loading of images combine to reduce the total file size of web pages for faster performance speeds.
10web Booster offers all of these services in a single automated package to guarantee a 90+ Google PageSpeed score to web publishers for search engine optimization on any site.
PageSpeed score
Google uses Lighthouse with PageSpeed Insights to calculate the PageSpeed score and Core Web Vitals metrics in different ways. The PageSpeed score is based on lab data and includes related values for desktop and mobile device views. The Core Web Vitals metrics are:
- Largest Contentful Paint (LCP)
- First Input Delay (FID)
- Cumulative Layout Shift (CLS)
Core Web Vitals metrics are calculated on the basis of field data. Lighthouse replicates the metrics for publisher feedback so that web pages can be optimized based on Opportunities.
PageSpeed Opportunities provides developers with a list of issues that affect web page performance and the recommended steps to solve them. 10Web Booster automatically implements these solutions with front and back-end optimization for the best SEO results.
Core Web Vitals
In contrast to Lighthouse, which tests each URL individually for page load speed elements, the Core Web Vitals report is generated by Google using user data reports. The use of field data is charted by Google over 28 days for the purposes of search engine ranking by an algorithm.
The Core Web Vitals score includes results by status, metric type, and groups of similar web pages. If the web page is not indexed by Google, the Core Web Vitals score is not generated. The Core Web Vitals score collates the results of the three metrics: LCP, FID, and CLS.
Each part of the analytics receives a score of “good”, “needs improvement”, or “poor” as well as suggestions for optimization in the Opportunities recommendations. The Performance score represents a weighted average of the metric results assessed by the Lighthouse framework.
The raw metrics values collected by PSI are converted into a 0-100 ratio on the basis of comparison to an archive of HTTP(S) sites. Lighthouse Performance scores fluctuate over time.
Largest Contentful Paint (LCP)
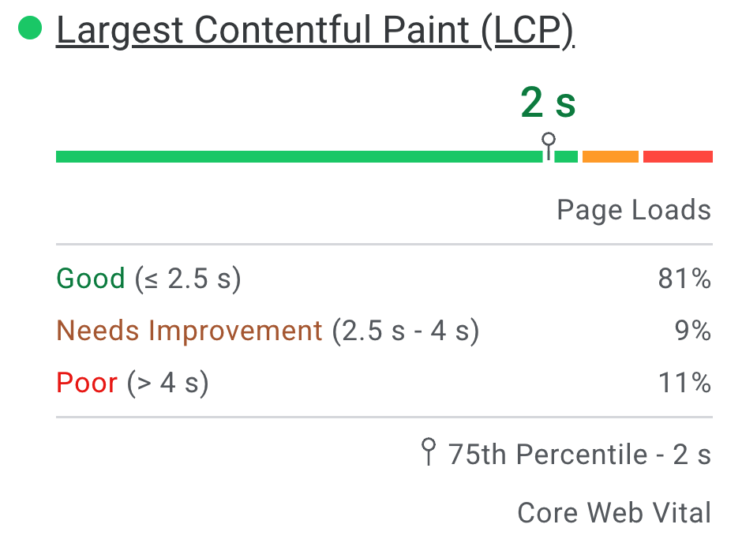
The Largest Contentful Paint (LCP) variable is one of the most important in the Core Web Vitals reports. This value establishes the largest viewable content section of the page and calculates the average time to load it by users across different devices.
The Largest Contentful Paint (LCP) score needs to be less than 2.5 seconds to rate as “good”. A value of over 4 seconds will result in a “poor” rating overall.
First Input Delay (FID)
The First Input Delay (FID) measures “the delta between when an input event is received and when the main thread is next idle”. Google calculates all visitor data and considers a “good” user experience one where 75% of the web page results are rated as in the proscribed range.
The First Input Delay (FID) value must be less than 100 ms to be rated as “good”. Anything over 300 ms is considered “poor”. The FID score is used to represent the responsiveness of URLs.
Cumulative Layout Shift (CLS)
The Cumulative Layout Shift (CLS) value charts the stability of a web page for viewers by monitoring the refactoring of content by the browser. When pages are resized by a browser to meet the requirements of a particular display, it causes a “shift” which is visible to the user during the page load. These factors decrease website usability and interactive engagement.
The time for this shift must be less than 100 ms for the Cumulative Layout Shift (CLS) to be considered “good”. Results over 250 ms are rated as “poor” and affect the SEO ranking.
First Contentful Paint (FCP)
The First Contentful Paint (FCP) value is calculated and charted by Lighthouse metrics but is not considered part of Core Web Vitals. This variable measures the amount of time between the initial request and the page load for the visible section of the browser. The content can include text, images, video, etc. which must be compressed to attain the best PageSpeed scores.
A time of less than 1.8 seconds for FCP is rated as “good”. Over 3 seconds is “poor”. The First Contentful Paint (FCP) variable is one of the best for gauging the initial user experience.
Time to First Byte (TTFB)
Time to First Byte (TTFB) measures the total amount of time from the initial request to the return of the first byte of data to the web browser. It is used to measure the combination of domain redirects, DNS server operations, SSL/TLS encryption establishment on connections, and script responsiveness on hardware. “Good” is less than 800 ms, “poor” is greater than 1.8 seconds.
Lab Data
The PageSpeed Insights (PSI) score is based on lab data from an URL that is collected by Lighthouse for analysis. This lab data is used to generate the metrics for a web page when calculating PageSpeed Insights scores. The Core Web Vitals results are produced from field data, i.e. from real-world user experiences collected by analytics within the Chrome browser.
Google does not reveal the exact method by which its search engine algorithms and results page ranking system operates. As a general rule, the lab data provided through PSI is used for reference purposes within the context of platform analytics. The Google search algorithm makes greater use of the exclusive field data generated by Chrome users under a proprietary license.
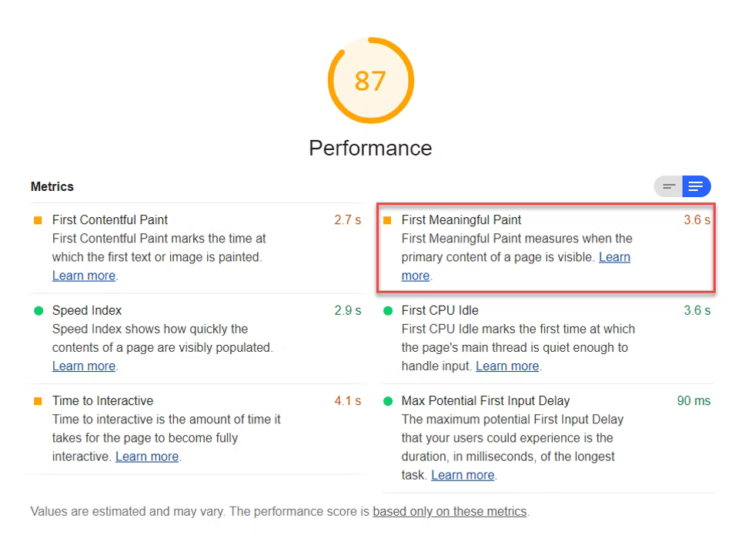
First Meaningful Paint (FMP)
The First Meaningful Paint data is tracked by Lighthouse in PSI and represents the time required to load the visible page elements to the user from the first request. The FMP value represents only “above the fold” content that is viewable in the user’s browser.
For Google PageSpeed score calculation, less than 2 seconds for the First Meaningful Paint (FMP) value is rated as “good” and render times over 4 seconds are rated as “poor”.
Speed Index
The Speed Index value is part of the Performance report generated by Lighthouse in PSI. This variable compares the website to HTTP archives as a benchmark. The Speed Index indicates how quickly web page content is rendered in a visible manner by the browser in device displays.
The Speed Index is unique in using a video recording of the page load for analysis. Each frame of the video is converted into a histogram that charts the visual rendering of page elements over time. The Speed Index includes two main variables: Start Render and Visually Complete.
The use of lazy-load on images, HTML/CSS compression, and server optimization can improve these scores. For Google, less than 3.4 seconds per page is “fast” and over 5.8 seconds is “slow”. The PSI Performance report includes a list of optimizations that can be implemented.
First CPU Idle
The First CPU Idle variable measures the time for the page elements to become minimally interactive. This includes most but not all of the UI elements. According to Google, the page must be able to respond to the majority of user requests in a reasonably functional manner.
Google has depreciated this variable in favor of Time To Interactive (TTI). Rates under 4.7 seconds are marked as “fast”, while any results over 6.5 seconds are considered “slow”.
Time to Interactive (TTI)
Time to Interactive (TTI) is measured by lab data in Lighthouse to represent the complete loading of UI elements in a manner that is functionally operable in the web browser. The TTI variable is used to differentiate between web pages that are visibly rendered in the browser but have not fully loaded the sub-elements required for usability, such as JavaScript dependencies.
The Time to Interactive (TTI) variable measures the responsiveness of web pages after the First Contentful Paint (FCP). A value of 5 seconds or less is rated as “good” by PSI overall.
Max Potential First Input Delay
The Max Potential First Input Delay variable measures the worst-case scenarios for a URL with time values for the duration of the longest task after the First Contentful Paint. Lighthouse uses lab data to measure the Max Potential FID for URLs in the generation of the results scores.
The Max Potential First Input Delay value is considered important due to the potential for extra delays in page element downloads not calculated by other metric values. A result of under 130 ms for Max Potential FID is considered “fast” and any results over 250 ms are rated as “slow”.
Opportunities
A Lighthouse audit report generated by PageSpeed Insights has sections for Opportunities, Diagnostics, and Passed Audits. The Opportunities section lists the suggested optimizations that can be implemented to improve the PageSpeed score. The report also shows how much time each solution is expected to return to the page if implemented as recommended.
The 10Web Booster automates the implementation of Opportunities based on industry best practices with web scripts and servers. This is the easiest way to attain 90+ PSI scores.
Diagnostics
The Diagnostics section of the PageSpeed Insights report adds feedback for webmasters on how a web page adheres to industry standards for internet communications. This section can provide information on code, script, and database performance, as well as their optimization.
Passed Audits
The Passed Audits section of the PageSpeed Insights report for a URL simply shows which tests the page has passed when Lighthouse runs the benchmark comparisons from lab data. If the page fails an audit, there will be a display of the reasons with suggestions for repair.
What is a good PageSpeed score?
According to Google, “A score of 90 or above is considered good. 50 to 90 is a score that needs improvement, and below 50 is considered poor.” The Lighthouse report generated by PSI is based primarily on lab data and cannot be guaranteed for replication across all user devices. For this reason, the use of field data with Core Web Vitals reports can be more valuable for metrics. FID is only measured using real-world data because it depends on user actions.
Lighthouse replicates Core Web Vitals metrics by using Total Blocking Time (TBT) from lab data instead of First Input Delay (FID) from field data. The use of PageSpeed Insights is intended to allow web publishers to view and optimize their PageSpeed scores using open-source tools.
If your pages fail to score 90+ on Google PageSpeed tests, consider an option like 10Web Booster. The ability to fully automate web server and script optimization leads to faster TTFB.

How to improve your PageSpeed Insights score?
In order to improve your Google PageSpeed Insights score, first implement the recommendations from the Opportunities and Diagnostics pages in the report screen.
Common recommendations listed under Opportunities are to defer offscreen images, eliminate render-blocking resources, and remove unused CSS. Diagnostics reports suggest reducing the impact of third-party code, minimizing threads, avoiding excessive DOM size, implementing caching, and eliminating long JavaScript execution times. Add plugins to CMS sites for this.
By automating these tasks consistently across all website pages using a PageSpeed utility like 10Web Booster, you can more easily improve Google PageSpeed scores. 10Web Booster will optimize WordPress CMS script functionality (including WooCommerce and other ecommerce store solutions) without the need to install any modules or plugins to your site for it to work.
Listed below are the main techniques implemented by 10Web Booster for improving PageSpeed Insights scores. The application of these techniques is also recommended for improving Core Web Vitals ratings. All of the options are derived from the PageSpeed Insights audit reports.
Optimize images
Optimizing images through file size compression and format conversion is one of the best ways to reduce the total size of downloads required on web pages. 10Web Booster offers lazy-loading for images, preloading, and the automatic conversion of images to match the size of displays.
Lazy-loading is a technique that delays the download of image files on a web page until the user opens the section in which they are displayed. This leads to faster render times for browsers and improves PageSpeed Insights scores. Preloading accelerates web page display times.
Configure the web server to automatically convert .gif, .jpg, and .png files to the WebP format for even more compression options. Caching images in a CDN will improve download speeds when compared to a single web server. Remove the metadata on images to shrink the files further.
Clear up redirects
Domain redirects increase the time required for a web server to begin processing an HTTP(S) request by requiring multiple address changes in the routing. Google PageSpeed Insights gives a higher rank to URLs that resolve without any domain forwarding or required redirections.
An example of domain forwarding is auto-loading mobile devices on app.site.com rather than site.com directly. The shift between domain names adds extra time to the page load factors.
Enable compression
The 10Web Booster platform enables compression on HTML, CSS, and image files so that they can be loaded by the user browser more quickly. There are numerous caching plugin solutions for WordPress that can automate this process as well. WP Rocket, WP Super Cache, W3 Total Cache, Perfmatters, and WP Fastest Cache are among the most popular with developers.
10Web Booster automates compression at the web server level and operates across scripts for even better performance. You don’t need to install any modules for 10Web Booster.
Minify CSS, HTML, JavaScript
Minification removes unrequired code elements from HTML, CSS, and JavaScript files so the package is even smaller when it is compressed. To do this, install the WP Super Minify plugin or another caching solution on WordPress that includes minification of files in the configuration.
10Web Booster provides HTML, CSS, and JavasScript minification in front-end optimization that is fully automated on the web server. This can be combined with website caching and CDN use.
Prioritize above-the-fold content
Compression and minification of HTML, CSS, and JavaScript files are used to prioritize above-the-fold content on web pages so that a small initial target file size can be attained.
Web pages that require excessive data to load the above-the-fold content to the user will need to make repeated browser calls from the server that increase the total response time and decrease PageSpeed Insight scores. It is recommended to limit the use of images and third-party widgets in this section for better results with Google PageSpeed optimization.
Structure HTML to load visible content elements first to pass the Google PageSpeed testing requirements across all variables and metrics. The compression and minification of required script files is a core feature that is automated with the 10Web Booster platform functionality.
Improving server response time
Google requires a server response time of less than 200 ms to pass the PageSpeed Insights test with a “good” rating. The fastest sites set a target of less than 100 ms for server response.
The server response time depends on DNS routing, domain redirects, and the scripts running on the hardware in a data center. A multi-layered, automated solution like 10Web Booster includes both front-end and back-end optimization for a website. CDN caching will also improve web server response times by implementing geo-location and load balancing on user requests.
Eliminate render-blocking JavaScript
JavaScript loads first in a web browser which can cause delays if a website includes a large number of JavaScript files that are used for rendering the interface and content displays.
One means to improve this is to delay the call for JavaScript files until after the primary page elements have been loaded. This allows publishers to prioritize above-the-fold content and attain faster PageSpeed scores. Combining the required files for each page load before they are minified and compressed is another popular method to eliminate render-blocking JavaScript.
Leverage browser caching
Developers need to identify each element required for page loads and associate it with a browser cache limit that is publicly declared. This allows web pages to load faster by leveraging the browser cache to store GUI elements like scripts and images that are repeatedly used across the domain. The browser cache limit sets the amount of time these files are localized.
By caching the required files in the local user browser, the amount of data required by downloads is limited on every page load. This leads to better field data for website metrics.
Critical CSS
Another PageSpeed Insights optimization that is used to improve page load times is to prioritize critical CSS files by injecting them into HTML pages as inline scripts. This avoids the need to load CSS as a separate file and permits a lower overall total file size for faster browsing speeds.
Instead of loading a stylesheet with the code for the entire website, it is recommended to only load the CSS that is actually used by the given page. Avoid excessive CSS file size for better website performance. 10Web Booster optimization implements these features across websites automatically by configuring the web server to implement best practices for PSI in production.
